Recently we had an issue where we ran out of inodes on the /tmp mount point of one of our database servers. After investigating what was causing the issue we discovered a sub-directory called orbit-oracle with lots of 0 byte files with a prefix of linc-*. I deleted the files which freed up some of the free space for our inodes but more files were continuing to get generated.
A quick search on MOS turned up a direct hit on the issue (Doc ID 2106496.1). The doc mentions making sure that the messagebus service is started. When I checked our problem server I found that this service was not started while on the other database servers it is running.
$ service messagebus status
messagebus is stopped
We had contacted our Linux Admin to look into the issue and restart the service. He restarts the service and then we confirm it’s running.
$ service messagebus status
messagebus (pid 7856) is running...
After the service is restarted we no longer see the 0 byte files being generated. Later on we hear back from our Linux Admin on what may have possibly happened. He had been installing some RPMS and one of them was for dbus. He believes that the service was never restarted at that time. Not a huge deal but how do we stay alerted to an inode issue going forward?
We use Enterprise Manager 12c for our monitoring and alerting so I researched the documentation and was unable to find a built in metric for checking inode free space. So the likely option was to create a custom metric extension. I found a great blog post by DBAHarrison on how to create a metric extension in EM to monitor inodes. Additionally, he provided the export of the metric extension for download so you can import it into your own EM.
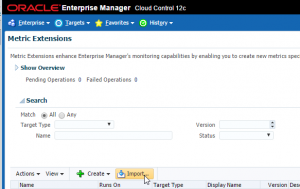
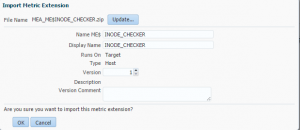
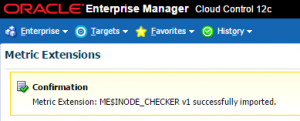
Let’s get started and add this metric extension to EM12c. First let’s import the metric extension that we downloaded.
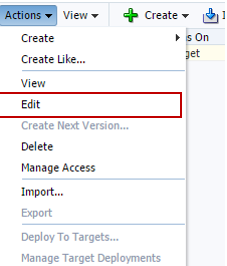
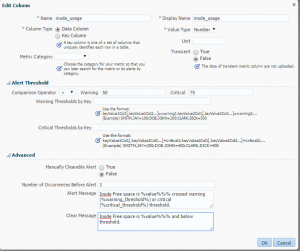
Now that the metric extension has been added, we edit the default thresholds and add a customized message for the alert/clear messages. Navigate to Actions > Edit.
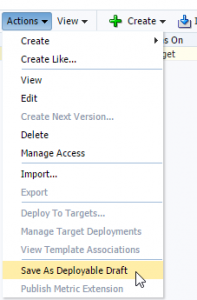
Next we navigate to the Actions menu and choose Save as Deployable Draft.
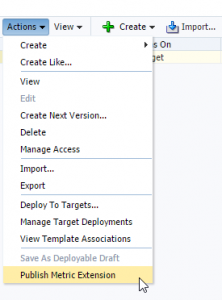
At this point we have the ability to Deploy to Targets and run a test to make sure it’s working. I won’t demonstrate that in this post but instead will go to the Actions menu again and chose Publish Metric Extension.
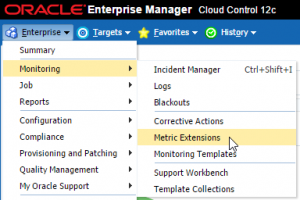
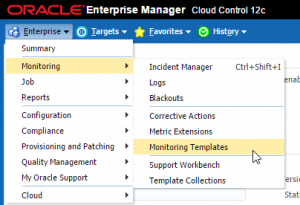
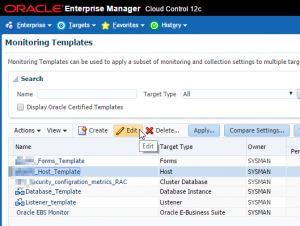
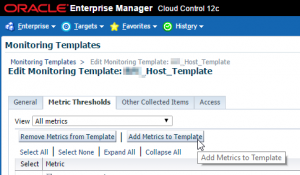
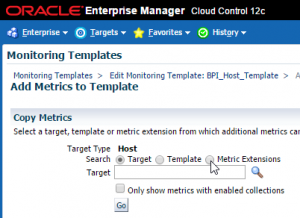
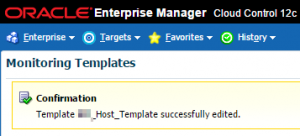
Now that my new metric extension has been published, let’s add it to our monitoring template. I chose to add this to our Host template. Navigate to Enterprise > Monitoring > Monitoring Templates and follow the next set of steps to get this added.
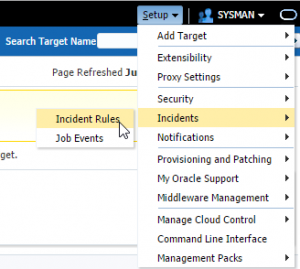
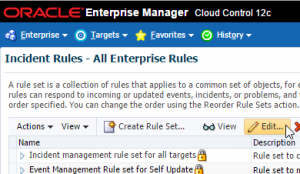
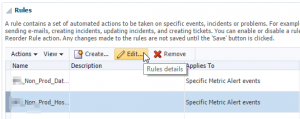
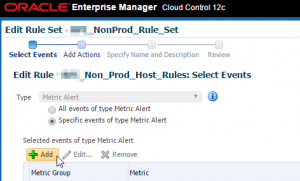
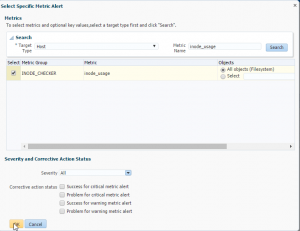
Okay now it’s been added to our monitoring template. There is one more step left. Hang in there! 🙂 We need to add this metric to our incident rules. Navigate to Setup > Incidents > Incident Rules and follow the steps.
Next I want to test to see if the metric is working. In a non-production environment I run a small FOR loop to see if I could trigger the alert. I use the /tmp mount point and determine the number of inodes that I need to consume in order to cross my threshold.
Check the number of inodes available on /tmp (655,360)
$ df -i | grep /tmp
655360 42 655318 1% /tmp
Let’s create a directory for our files and then use a simple loop to generate lots of small 0 byte files.
$ mkdir -p /tmp/test

$for i in {1..350000}
do
touch /tmp/test/t$i.txt
done
Check the percentage of disk and inode free space.
$ df -h | grep /tmp
9.9G 224M 9.2G 3% /tmp


$ df -i | grep /tmp
655360 350044 305316 54% /tmp
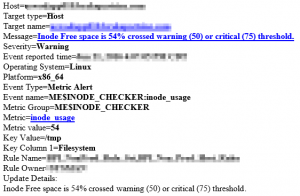
A little bit later I received my alert (with my customized message)!
Summary
Checking for inodes is probably not something we consider frequently as we are typically only concerned about percentage of free space of the actual disk. Given the fact that running out of inodes can put you in a similar predicament as running out of actual free space, you should consider this as one of the metrics that you are monitoring for. In the event you don’t have Enterprise Manager, you can use a shell script scheduled in cron to do something similar.

